Bureau of Transportation Statistics. (2026). Marketing Carrier On-Time Performance. U.S. Department of Transportation. https://www.transtats.bts.gov/ONTIME/
The Sunday after Thanksgiving is the busiest day of the holiday period, and it was in each of the last four seasons. The TSA screened 3,134,613 people on Sunday, November 30, 2025, the highest daily count in the TSA figures published since 2019, and 3,088,836 on Sunday, December 1, 2024, the third highest.
This page works out which days to fly for Thanksgiving, Christmas and New Year's 2026. It uses two public sets of records. One is TSA checkpoint counts for 2022 to 2025. The other is flight-by-flight records from the Bureau of Transportation Statistics for 40 large US airports over the same four seasons. Crowds and reliability don't always agree, so the page reports both.
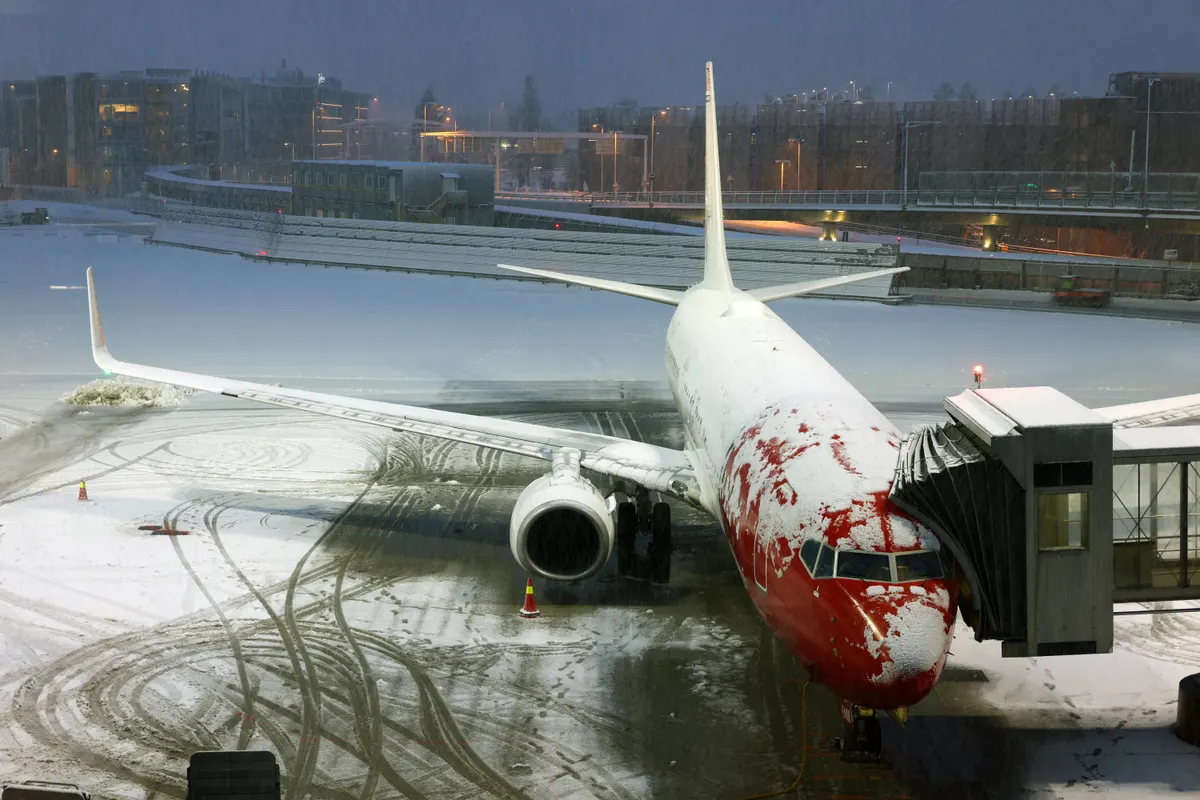
A snow-covered airliner at the gate during a winter storm. Photo: Depositphotos.
Key Insights
Thanksgiving 2026 (Thursday, November 26): the heaviest day is Sunday, November 29, with a crowd index of 119 against a window average of 100. Thanksgiving Day itself is the lightest at 62.
Reliability tells a different story from crowds. In the median of the four seasons, 8.1% of flights on Thanksgiving Day were cancelled, diverted or 15 or more minutes late. On the Sunday after it was 28.4%.
Christmas 2026 (Friday, December 25): the lightest days for screening are Christmas Day (81), Christmas Eve (82) and New Year's Eve (87).
The days right after Christmas were the roughest for flights. From December 26 to 29, between 35% and 39% of flights ran off plan, against 13.7% on Christmas Day.
Airlines differ most at Christmas. Leaving out the disrupted 2022 season, Delta and United ran closest to plan among the large carriers, with 22% of flights off plan at each.
The best and worst days at a glance
These picks use both measures below: how crowded the checkpoint is, and how many flights ran off plan. Each day is ranked inside its own window.
Best and worst days for the 2026 holidays, from the 2022 to 2025 data
Holiday
Best days to fly out
Best days to fly back
Days to avoid
Thanksgiving, Thursday November 26
Nov21Sat, Nov 21Nov23Mon, Nov 23
Nov27Fri, Nov 27Dec1Tue, Dec 1
Nov29Sun, Nov 29Nov19Thu, Nov 19Nov20Fri, Nov 20
Christmas, Friday December 25
Dec18Fri, Dec 18Dec24Thu, Dec 24Dec25Fri, Dec 25Christmas Day
Dec31Thu, Dec 31Jan1Fri, Jan 1Jan2Sat, Jan 2
Dec26Sat, Dec 26toDec29Tue, Dec 29
New Year's, Friday January 1 2027
Dec31Thu, Dec 31
Dec31Thu, Dec 31Jan1Fri, Jan 1New Year's DayJan6Wed, Jan 6
Dec26Sat, Dec 26toDec29Tue, Dec 29Jan3Sun, Jan 3toJan4Mon, Jan 4
Plan your own trip
Crowd levels are national, because TSA publishes one count for the whole country. Reliability follows the airport you choose.
Holiday flight plannerPick a holiday, an airport and an airline. Crowds are national; flights off plan follow the airport you pick.
Thanksgiving 2026 at All 40 airports combined
Nov19Thu, Nov 19Crowd101Off plan26.7%
Nov20Fri, Nov 20Crowd109Off plan22.5%
Nov21Sat, Nov 21Crowd97Off plan15.5%
Nov22Sun, Nov 22Crowd105Off plan17.0%
Nov23Mon, Nov 23Crowd99Off plan16.1%
Nov24Tue, Nov 24Crowd105Off plan17.3%
Nov25Wed, Nov 25Crowd109Off plan15.7%
Nov26Thu, Nov 26Thanksgiving DayCrowd62Off plan8.1%
Nov27Fri, Nov 27Crowd91Off plan12.9%
Nov28Sat, Nov 28Crowd105Off plan19.9%
Nov29Sun, Nov 29Crowd119Off plan28.4%
Nov30Mon, Nov 30Crowd109Off plan20.8%
Dec1Tue, Dec 1Crowd87Off plan20.1%
Check your own dates
OutNov21Sat, Nov 21Better third
Crowd index 97, the 4th quietest of 13 days. 15.5% of flights off plan, the 3rd best of 13 days.
BackNov27Fri, Nov 27Better third
Crowd index 91, the 3rd quietest of 13 days. 12.9% of flights off plan, the 2nd best of 13 days.
Calmer for that dayBusier or less reliableColours rank the days inside the window.
Crowd is the TSA screening index (100 is the window average). Off plan is the share of flights cancelled, diverted or 15 or more minutes late, 2022 to 2025.
Thanksgiving 2026: the day-by-day picture
Thanksgiving always falls on a Thursday, so the four seasons line up weekday for weekday and the pattern can be read directly. The crowd has two peaks: the days around the Wednesday before, and the weekend after. The Sunday, November 29, is the heaviest day by a wide margin at an index of 119.1. In each of the four seasons the busiest day of the window was the Sunday after Thanksgiving.
Thanksgiving 2026, day by dayCrowd index and flights off plan, 2022 to 2025
Nov19Thu, Nov 19Crowd101Off plan26.7%
Nov20Fri, Nov 20Crowd109Off plan22.5%
Nov21Sat, Nov 21Crowd97Off plan15.5%
Nov22Sun, Nov 22Crowd105Off plan17.0%
Nov23Mon, Nov 23Crowd99Off plan16.1%
Nov24Tue, Nov 24Crowd105Off plan17.3%
Nov25Wed, Nov 25Crowd109Off plan15.7%
Nov26Thu, Nov 26Thanksgiving DayCrowd62Off plan8.1%
Nov27Fri, Nov 27Crowd91Off plan12.9%
Nov28Sat, Nov 28Crowd105Off plan19.9%
Nov29Sun, Nov 29Crowd119Off plan28.4%
Nov30Mon, Nov 30Crowd109Off plan20.8%
Dec1Tue, Dec 1Crowd87Off plan20.1%
Calmer for that dayBusier or less reliableColours rank the days inside this window only.
The Saturday (November 21) and Monday (November 23) before Thanksgiving are the calmest ordinary days, with crowd indexes of 97 and 99 and 15.5% and 16.1% of flights off plan. Wednesday, November 25, is the second busiest outbound day at 109, yet flights held up there: 15.7% off plan, close to the Monday figure.
The Thursday and Friday a week out (November 19 and November 20) were the weakest outbound days for reliability, at 26.7% and 22.5% off plan. The best and worst seasons for November 19 were far apart, 15% and 28%, so the result swings with the weather and operations of each year.
Flying back
The Friday after, November 27, is the best return day on reliability (12.9% off plan) and a light day at the checkpoint (91). Tuesday, December 1, is the lightest of the ordinary return days at 87, but it ran 20.1% off plan.
The Sunday, November 29, is the worst return day on both measures: a crowd index of 119 and 28.4% of flights off plan. In the worst season that Sunday reached 50%.
Thanksgiving Day itself is the quietest day of the year for screening (62) and 8.1% of flights were off plan. Airlines schedule far fewer flights, though: about 8,700 on Thanksgiving Day in a typical season, against about 15,200 on a typical day in the window. If your trip allows it, it's the easiest day to fly. This page doesn't measure fares, so it can't say whether tickets are cheaper.
Thanksgiving 2026 by day. Each figure is the median of the four seasons; ranges show the lowest and highest season.
Day
Crowd index
Flights off plan
Rating
Nov19Thu, Nov 19
101.2 97 to 104
26.7% 15% to 28%
Worse third
Nov20Fri, Nov 20
108.8 108 to 110
22.5% 16% to 28%
Worse third
Nov21Sat, Nov 21
97.1 96 to 99
15.5% 13% to 24%
Better third
Nov22Sun, Nov 22
104.5 102 to 106
17.0% 15% to 24%
Middle third
Nov23Mon, Nov 23
99.1 98 to 102
16.1% 15% to 24%
Better third
Nov24Tue, Nov 24
105.4 105 to 107
17.3% 14% to 22%
Middle third
Nov25Wed, Nov 25
108.7 106 to 111
15.7% 15% to 23%
Middle third
Nov26Thu, Nov 26Thanksgiving Day
61.7 61 to 64
8.1% 5% to 16%
Better third
Nov27Fri, Nov 27
90.7 89 to 93
12.9% 12% to 16%
Better third
Nov28Sat, Nov 28
105.2 104 to 110
19.9% 17% to 39%
Middle third
Nov29Sun, Nov 29
119.1 117 to 122
28.4% 23% to 50%
Worse third
Nov30Mon, Nov 30
108.5 106 to 113
20.8% 19% to 37%
Worse third
Dec1Tue, Dec 1
87.4 87 to 89
20.1% 13% to 35%
Better third
Christmas 2026: a Friday holiday
Christmas moves around the week. In the four seasons used here it fell on a Sunday (2022), Monday (2023), Wednesday (2024) and Thursday (2025), never on a Friday, so the days are matched by distance from December 25 and not by weekday. Sundays run 11% above the weekly average in ordinary weeks, and December 27, 2026 is a Sunday.
Christmas 2026, day by dayCrowd index and flights off plan, 2022 to 2025
Dec18Fri, Dec 18Crowd98Off plan23.2%
Dec19Sat, Dec 19Crowd103Off plan24.1%
Dec20Sun, Dec 20Crowd103Off plan28.4%
Dec21Mon, Dec 21Crowd108Off plan30.2%
Dec22Tue, Dec 22Crowd109Off plan21.5%
Dec23Wed, Dec 23Crowd107Off plan22.9%
Dec24Thu, Dec 24Crowd82Off plan24.6%
Dec25Fri, Dec 25Christmas DayCrowd81Off plan13.7%
Dec26Sat, Dec 26Crowd105Off plan35.4%
Dec27Sun, Dec 27Crowd107Off plan36.0%
Dec28Mon, Dec 28Crowd107Off plan39.3%
Dec29Tue, Dec 29Crowd107Off plan37.3%
Dec30Wed, Dec 30Crowd107Off plan22.1%
Dec31Thu, Dec 31Crowd87Off plan20.4%
Jan1Fri, Jan 1Crowd92Off plan22.3%
Jan2Sat, Jan 2Crowd103Off plan22.4%
Jan3Sun, Jan 3Crowd99Off plan29.8%
Calmer for that dayBusier or less reliableColours rank the days inside this window only.
The lightest days before Christmas are Christmas Eve (82) and Friday, December 18 (98). Christmas Day is the lightest of all at 81, and 13.7% of flights ran off plan, the best figure of the window.
The heaviest outbound days are Tuesday, December 22 (109), Monday, December 21 (108) and Wednesday, December 23 (107). Reliability does not follow the crowds neatly here: December 21 and December 20 were the weakest outbound days at 30.2% and 28.4% off plan, while December 22 and 23 ran better, at 21.5% and 22.9%.
Flying back
The days after Christmas are the problem. From December 26 to 29, between 35% and 39% of flights were cancelled, diverted or late, and the crowd stays near 105 to 107 with no day that stands out as light. The best season for each of December 26 and 27 still ran 28% or more off plan, so this isn't a one-year effect. December 2022 was the worst season for December 26 and 27.
The picture improves from December 30: 22.1% off plan on December 30, 20.4% on New Year's Eve and 22.3% on New Year's Day, with crowds of 87 and 92 on the last two. Returning on December 31 or later is the clearest gain in the Christmas data.
Christmas 2026 by day. Each figure is the median of the four seasons; ranges show the lowest and highest season.
Day
Crowd index
Flights off plan
Rating
Dec18Fri, Dec 18
98.2 91 to 108
23.2% 21% to 27%
Better third
Dec19Sat, Dec 19
103.4 93 to 107
24.1% 15% to 44%
Middle third
Dec20Sun, Dec 20
103.3 102 to 110
28.4% 16% to 38%
Middle third
Dec21Mon, Dec 21
107.7 105 to 112
30.2% 15% to 36%
Worse third
Dec22Tue, Dec 22
108.6 106 to 113
21.5% 20% to 57%
Middle third
Dec23Wed, Dec 23
106.5 96 to 107
22.9% 17% to 74%
Middle third
Dec24Thu, Dec 24
82.2 80 to 85
24.6% 18% to 65%
Better third
Dec25Fri, Dec 25Christmas Day
80.8 78 to 83
13.7% 9% to 55%
Better third
Dec26Sat, Dec 26
104.7 102 to 109
35.4% 29% to 59%
Worse third
Dec27Sun, Dec 27
107.4 100 to 110
36.0% 28% to 48%
Worse third
Dec28Mon, Dec 28
106.7 99 to 111
39.3% 23% to 43%
Worse third
Dec29Tue, Dec 29
107.0 100 to 109
37.3% 18% to 44%
Worse third
Dec30Wed, Dec 30
107.3 104 to 109
22.1% 16% to 32%
Middle third
Dec31Thu, Dec 31
86.6 84 to 89
20.4% 15% to 27%
Better third
Jan1Fri, Jan 1
91.8 89 to 94
22.3% 12% to 30%
Better third
Jan2Sat, Jan 2
102.6 98 to 109
22.4% 18% to 44%
Better third
Jan3Sun, Jan 3
99.1 99 to 102
29.8% 19% to 42%
Middle third
New Year's 2026 to 2027: Thursday Eve, Friday Day
The New Year's window runs from December 26 to January 6. Its index is set against that window's own average, so it cannot be compared directly with the Christmas window, which overlaps it. The peak is December 27 to 30, when every day sits at an index of 107 to 109. Then the crowd drops: 87 on New Year's Eve and 92 on New Year's Day.
New Year's 2026 to 2027, day by dayCrowd index and flights off plan, 2022 to 2025
Dec26Sat, Dec 26Crowd106Off plan35.4%
Dec27Sun, Dec 27Crowd109Off plan36.0%
Dec28Mon, Dec 28Crowd107Off plan39.3%
Dec29Tue, Dec 29Crowd108Off plan37.3%
Dec30Wed, Dec 30Crowd108Off plan22.1%
Dec31Thu, Dec 31Crowd87Off plan20.4%
Jan1Fri, Jan 1New Year's DayCrowd92Off plan22.3%
Jan2Sat, Jan 2Crowd103Off plan22.4%
Jan3Sun, Jan 3Crowd100Off plan29.8%
Jan4Mon, Jan 4Crowd96Off plan31.7%
Jan5Tue, Jan 5Crowd96Off plan26.9%
Jan6Wed, Jan 6Crowd88Off plan24.2%
Calmer for that dayBusier or less reliableColours rank the days inside this window only.
New Year's Eve is the best single day in the window on both measures: an index of 87 and 20.4% of flights off plan. New Year's Day is also light, at 92 and 22.3%. The days from December 26 to 29 had the weakest reliability, at 35% to 39% off plan.
For the return, Wednesday, January 6 is the lightest day at 88 and 24.2% off plan. Sunday, January 3 and Monday, January 4 are the weak days: 29.8% and 31.7% off plan. Saturday, January 2 is the better weekend day on reliability at 22.4% off plan, with a crowd index of 103.
New Year's 2026 to 2027 by day. Each figure is the median of the four seasons; ranges show the lowest and highest season.
Day
Crowd index
Flights off plan
Rating
Dec26Sat, Dec 26
105.6 103 to 109
35.4% 29% to 59%
Worse third
Dec27Sun, Dec 27
108.5 102 to 111
36.0% 28% to 48%
Worse third
Dec28Mon, Dec 28
107.1 100 to 113
39.3% 23% to 43%
Worse third
Dec29Tue, Dec 29
108.1 102 to 109
37.3% 18% to 44%
Worse third
Dec30Wed, Dec 30
108.1 105 to 111
22.1% 16% to 32%
Middle third
Dec31Thu, Dec 31
87.4 84 to 90
20.4% 15% to 27%
Better third
Jan1Fri, Jan 1New Year's Day
92.1 90 to 95
22.3% 12% to 30%
Better third
Jan2Sat, Jan 2
103.0 99 to 110
22.4% 18% to 44%
Middle third
Jan3Sun, Jan 3
99.9 99 to 103
29.8% 19% to 42%
Middle third
Jan4Mon, Jan 4
96.1 93 to 109
31.7% 12% to 39%
Middle third
Jan5Tue, Jan 5
95.7 93 to 100
26.9% 14% to 40%
Better third
Jan6Wed, Jan 6
88.1 75 to 95
24.2% 13% to 49%
Better third
Why the numbers are not adjusted for the weekday
Christmas and New Year's land on different weekdays each year, so we tested whether adjusting for the weekday would sharpen the 2026 picture. The test left each season out in turn and tried to predict its crowd pattern from the other three. The weekday-adjusted estimate missed by 10.1 index points on average at Christmas and 9.4 at New Year's. The plain median by distance from the holiday missed by 3.4 and 4.0. At Thanksgiving, where weekdays already match, both missed by 2.4.
The adjustment made the forecast worse, so it is not used. The figures are plain medians by day. Ordinary weeks do show a weekday pattern, from 14.6% below the weekly average on Tuesdays to 11.4% above on Sundays across 369 days.
Which airlines held up best
The tables count flights marketed by each airline, including regional flights flown for it, from the 40 airports in this study. An airline's figure mixes the airports it uses most, so it is a guide to the whole network and not a promise for one route.
At Thanksgiving, Delta ran closest to plan, with 17.0% of its flights off plan on average across the four seasons. At Christmas the table shows two figures for each airline because the 2022 season distorts it. Southwest cancelled 25.8% of its flights in the 2022 Christmas window and between 0.8% and 1.0% in each of the other three seasons, which is why its all-season cancellation rate of 6.7% is the highest in the Christmas table. Without 2022 its off-plan share is 27.4%, in the middle of the group. Delta (22%) and United (22%) are lowest among the large carriers once 2022 is removed. JetBlue and Spirit are highest at Christmas and New Year's in every version of the table.
Airline tables for all three holidays
Thanksgiving: flights per airline at the 40 airports, 2022 to 2025
Airline
Flights, all seasons
Off plan, average of seasons
Off plan, average without 2022
Cancelled
Hawaiian small sample
4,520
17.4%
14.9%
0.50%
Delta
156,956
17.0%
17.1%
0.31%
Allegiant small sample
1,266
22.7%
18.8%
0.20%
Southwest
139,748
19.6%
19.4%
0.40%
United
129,245
18.9%
19.6%
0.73%
Alaska
30,062
21.2%
21.1%
1.12%
American
176,563
21.4%
21.9%
0.99%
Frontier
15,040
27.5%
23.4%
0.50%
Spirit
17,743
27.8%
26.7%
0.47%
JetBlue
21,792
29.9%
28.1%
0.62%
Christmas: flights per airline at the 40 airports, 2022 to 2025
Airline
Flights, all seasons
Off plan, average of seasons
Off plan, average without 2022
Cancelled
Allegiant small sample
1,621
20.6%
13.7%
1.90%
Delta
187,613
24.1%
21.6%
2.23%
United
173,984
26.0%
21.8%
1.71%
Hawaiian small sample
5,772
28.8%
22.8%
2.00%
American
229,029
26.2%
24.2%
1.34%
Alaska
40,913
32.3%
27.0%
3.88%
Southwest
193,634
34.8%
27.4%
6.71%
Frontier
19,500
34.5%
29.3%
2.94%
Spirit
26,311
38.4%
34.5%
4.23%
JetBlue
30,754
43.3%
40.6%
2.55%
New Year's: flights per airline at the 40 airports, 2022 to 2025
Airline
Flights, all seasons
Off plan, average of seasons
Off plan, average without 2022
Cancelled
Allegiant small sample
1,174
21.3%
16.0%
0.70%
Hawaiian small sample
3,756
22.4%
20.8%
0.90%
Delta
123,846
24.4%
23.3%
1.70%
United
113,162
27.3%
25.4%
1.76%
American
160,846
27.3%
26.8%
1.63%
Alaska
28,316
29.8%
27.2%
2.45%
Southwest
131,746
33.9%
29.2%
6.47%
Frontier
12,735
37.8%
33.9%
3.14%
Spirit small sample
8,694
45.3%
41.8%
4.24%
JetBlue
18,549
45.3%
44.4%
2.30%
Which airports ran smoothest
Salt Lake City, Washington Reagan and LaGuardia are among the five smoothest airports in the Christmas or New Year's tables. Fort Lauderdale and Orlando are in the bottom five in all three windows. Fort Lauderdale is the largest outlier, with 40% of flights off plan across the Christmas window and 46% across New Year's. The data doesn't say why, and we haven't guessed.
Smoothest and roughest airports by holiday, share of flights off plan
Holiday window
Smoothest five
Roughest five
Thanksgiving
Honolulu 12%, Washington Dulles 14%, Salt Lake City 14%, Houston Bush 15%, Los Angeles 15%
Fort Lauderdale 26%, Orlando 24%, Miami 22%, Detroit 21%, Dallas-Fort Worth 21%
Christmas
Salt Lake City 20%, Washington Reagan 21%, LaGuardia 21%, Houston Bush 22%, Raleigh-Durham 22%
Fort Lauderdale 40%, San Diego 33%, Chicago Midway 33%, Baltimore/Washington 32%, Orlando 31%
New Year's
LaGuardia 19%, Honolulu 19%, Washington Reagan 20%, Salt Lake City 23%, Portland 23%
Fort Lauderdale 46%, Orlando 38%, Miami 35%, Baltimore/Washington 34%, Chicago Midway 32%
All 40 airports
All 40 airports: share of flights off plan, 2022 to 2025
Airport
Thanksgiving
Christmas
New Year's
ATL Hartsfield-Jackson Atlanta International
17.0%
23.5%
26.7%
AUS Austin-Bergstrom International
17.8%
26.4%
27.3%
BNA Nashville International
18.1%
24.3%
25.0%
BOS Boston Logan International
18.7%
26.6%
26.0%
BWI Baltimore/Washington International
20.4%
32.0%
34.4%
CLT Charlotte Douglas International
17.4%
22.9%
24.9%
DAL Dallas Love Field
17.0%
29.7%
28.0%
DCA Ronald Reagan Washington National
19.5%
21.3%
20.2%
DEN Denver International
16.2%
25.8%
27.5%
DFW Dallas/Fort Worth International
20.7%
26.7%
27.6%
DTW Detroit Metropolitan Wayne County
20.8%
22.2%
24.1%
EWR Newark Liberty International
19.7%
26.1%
26.9%
FLL Fort Lauderdale-Hollywood International
26.0%
40.0%
45.7%
HNL Daniel K. Inouye International
12.3%
22.1%
19.4%
HOU William P. Hobby
15.7%
25.6%
25.7%
IAD Washington Dulles International
13.9%
22.7%
24.7%
IAH George Bush Intercontinental
14.8%
21.8%
23.9%
IND Indianapolis International
15.6%
22.9%
25.4%
JFK John F. Kennedy International
20.2%
29.7%
30.5%
LAS Harry Reid International
18.0%
24.7%
26.3%
LAX Los Angeles International
15.2%
26.7%
26.0%
LGA LaGuardia
18.5%
21.5%
18.7%
MCI Kansas City International
19.5%
23.5%
25.7%
MCO Orlando International
24.3%
31.1%
37.7%
MDW Chicago Midway International
18.3%
32.6%
32.3%
MIA Miami International
21.9%
29.3%
35.2%
MSP Minneapolis-Saint Paul International
18.0%
23.3%
24.5%
MSY Louis Armstrong New Orleans International
17.4%
24.4%
26.1%
ORD Chicago O'Hare International
20.2%
25.1%
28.9%
PDX Portland International
16.1%
22.6%
22.6%
PHL Philadelphia International
18.3%
25.3%
26.5%
PHX Phoenix Sky Harbor International
16.9%
24.4%
23.9%
RDU Raleigh-Durham International
19.1%
22.1%
24.4%
SAN San Diego International
17.9%
33.1%
31.4%
SEA Seattle-Tacoma International
19.2%
25.4%
24.3%
SFO San Francisco International
16.7%
30.1%
31.3%
SLC Salt Lake City International
14.4%
19.8%
22.6%
SMF Sacramento International
16.1%
26.2%
25.6%
STL St. Louis Lambert International
19.3%
24.7%
26.5%
TPA Tampa International
17.6%
26.2%
32.2%
Weather: where the holiday windows are exposed
Weather exposure varies far more between airports than between holidays. This section counts hours in the ASOS airport weather record for each airport from 2000 to 2025, over two windows: the Thursday a week before Thanksgiving to the Tuesday after, and December 18 to January 6. An hour counts as low-visibility if the cloud ceiling was under 1,000 feet or visibility under 3 miles (instrument conditions), as windy if wind or gusts reached 25 knots, and as frozen if snow, ice pellets or freezing rain was reported.
Across the winter window the airports with the most hours of frozen precipitation are Detroit (15%), Chicago Midway (14%), Minneapolis-St. Paul (12%), Chicago O'Hare (12%), Indianapolis (10%). Those with the most low-visibility hours are Sacramento (18%), Detroit (17%), Indianapolis (16%), Chicago O'Hare (15%), Chicago Midway (15%). The windiest are JFK (12%), LaGuardia (11%), Boston (10%), Newark (7%). Phoenix and Las Vegas had almost no low-visibility hours in either window.
Weather exposure at every airport
Share of hours with each condition, 2000 to 2025. Honolulu is left out: its record covered less than 90% of hours.
The Department of Transportation publishes a dashboard of what the large airlines have committed to when a cancellation or delay is within the airline's control, such as maintenance, crew or fueling. Weather is not covered by those commitments, although airlines may still help at their discretion and a refund can still be owed. The table is copied from the dashboard as it stood when we read it, and airlines can change it, so check the live page before you rely on it.
Airline commitments for cancellations the airline controls, as listed by the U.S. Department of Transportation on Tuesday, October 20
Commitment
Alaska
Allegiant
American
Delta
Frontier
Hawaiian
JetBlue
Southwest
United
Rebook on the same airline
Yes
Yes
Yes
Yes
Yes
Yes
Yes
Yes
Yes
Rebook on a partner airline
Yes
No
Yes
Yes
No
Yes
Yes
No
Yes
Meal or voucher, 3+ hour wait
Yes
Yes
Yes
Yes
Yes
Yes
Yes
Yes
Yes
Hotel, overnight
Yes
Yes
Yes
Yes
No
Yes
Yes
Yes
Yes
Ground transport to hotel
Yes
Yes
Yes
Yes
No
Yes
Yes
Yes
Yes
Cash compensation, 3+ hours
No
No
No
No
No
No
No
No
No
Credit or voucher, 3+ hours
Yes
No
No
No
No
Yes
Yes
Yes
No
Miles, 3+ hours
Yes
No
No
No
No
Yes
No
No
No
Two points stand out. Every listed airline promises a meal or voucher after a wait of three hours or more, and none promises cash compensation. Partner-airline rebooking is a commitment from Alaska, American, Delta, Hawaiian, JetBlue and United, and not from Allegiant, Frontier or Southwest. The delay commitments on the dashboard are identical row for row.
Refunds are separate from those commitments.
The Department says a passenger is owed a refund if the airline cancels a flight for any reason, or significantly changes or delays it, and the passenger chooses not to travel or accept the credit or other compensation offered. For a domestic itinerary, significant means leaving or arriving three hours or more off schedule, a change of airport, or extra connections. Cancelled-flight refunds are due automatically if the passenger does not accept the alternative, within seven business days for a credit card payment, with a longer limit for other payment types, according to the Department's refund page. The refund rules date from April 2024 and the Department has updated some details since, so read the current text on that page.
What to do, step by step
Check the airline app first. Open the airline app or website as soon as a cancellation shows. Rebooking on the same airline at no extra cost is a commitment from every airline on the Department of Transportation dashboard.
Ask about another airline. If the next flight is a day away, ask whether the airline will rebook you on a partner. Alaska, American, Delta, Hawaiian, JetBlue and United list it as a commitment. Allegiant, Frontier and Southwest do not.
Find out whether the cause is in the airline's control. Meals, hotels and ground transport on the dashboard apply to cancellations and delays the airline controls. Ask the agent to record the reason. Weather is not covered by those commitments.
Claim a refund if you will not travel. If the airline cancels or significantly changes your flight and you decide not to travel, you are owed a refund of the ticket and not just a credit. Decline the voucher if you want the money back, and keep the cancellation notice.
Keep receipts and complain if needed. Keep receipts for meals, hotels and transport. If the airline does not honour a commitment or a refund, file a complaint with the Department of Transportation on its consumer complaint form.
Holiday flying questions
What are the best days to fly for Thanksgiving 2026?
The calmest days to fly out are Saturday, November 21 and Monday, November 23. The best return days are Friday, November 27 for reliability and Tuesday, December 1 for the lightest crowds. Thanksgiving Day itself is the quietest day of the period.
What is the worst day to fly for Thanksgiving?
The Sunday after, November 29. It had a crowd index of 119 against an average of 100 and 28.4% of flights were cancelled, diverted or 15 or more minutes late in the median season of 2022 to 2025.
Is it OK to fly on Thanksgiving Day itself?
Yes, for the checkpoint and for reliability. The TSA index on Thanksgiving Day was 62, the lowest of the window, and 8.1% of flights were off plan. Airlines run fewer flights that day, and this page does not measure fares.
When is the best time to fly for Christmas 2026?
Christmas Eve and Christmas Day are the lightest days for screening. Friday, December 18 is the lightest of the ordinary outbound days. For the return, December 31 or later was clearly better than December 26 to 29.
Is New Year's Day a good day to fly?
Yes. New Year's Eve and New Year's Day were the lightest days of the window after the holiday, with indexes of 87 and 92 and 20.4% and 22.3% of flights off plan.
Which airline runs closest to plan over the holidays?
It depends on the holiday and the airport. Over all four seasons Delta had the lowest off-plan share at Thanksgiving. At Christmas, Delta and United were lowest among the large carriers once the 2022 season, when Southwest cancelled a quarter of its flights, is set aside. The tables above give each airline's figure.
Which airports are worst for holiday delays?
Fort Lauderdale, Orlando, Miami, Baltimore/Washington and Chicago Midway were among the highest for off-plan flights at Christmas or New Year's. Salt Lake City, Washington Reagan and LaGuardia were among the lowest. The full 40-airport table is above.
What am I owed if my holiday flight is cancelled?
The Department of Transportation says you are owed a refund if the airline cancels your flight for any reason and you choose not to travel or accept the credit offered. Airlines also list commitments such as meals and hotels for cancellations they control. Read the current terms on the Department of Transportation pages before relying on them.
Method, data and downloads
Crowd index: TSA checkpoint passenger counts for each day, 2022 to 2025. The 2020 and 2021 seasons are excluded because of the pandemic. Days are matched by distance from the holiday. Each day's count is divided by the average of its window and multiplied by 100, then the median across the four seasons is taken. The windows are the Thursday a week before Thanksgiving to the Tuesday after, December 18 to January 3, and December 26 to January 6.
Flights off plan: for each season, the scheduled flights that were cancelled, diverted or arrived 15 or more minutes late, divided by all scheduled flights, from the Bureau of Transportation Statistics Marketing Carrier On-Time Performance files, by origin airport. A day's figure is the median of its four seasons, and the range is the lowest and highest season. An airport-day needs at least 100 flights in at least three seasons. Airline figures average the seasons with each season weighted equally, the flight counts are totals across seasons, and a cell needs at least 1,000 flights, at least 200 in three seasons including 2025, and known outcomes for 99.5 percent of them. 525 thin cells were suppressed.
Weather: hourly airport observations from the Iowa Environmental Mesonet for 2000 to 2025, in local standard time, requiring 90 percent of hours in a season and at least 20 seasons.
Ratings: each day is ranked inside its window on crowd index and on flights off plan. The ranks are averaged, and the lowest third of days is labelled better, the highest third worse. TSA data runs through October 15.
Limits: four seasons is a short record, and a single storm can move a day. These are historical patterns, not forecasts for 2026.
Bureau of Transportation Statistics. (2026). Marketing Carrier On-Time Performance. U.S. Department of Transportation. https://www.transtats.bts.gov/ONTIME/