
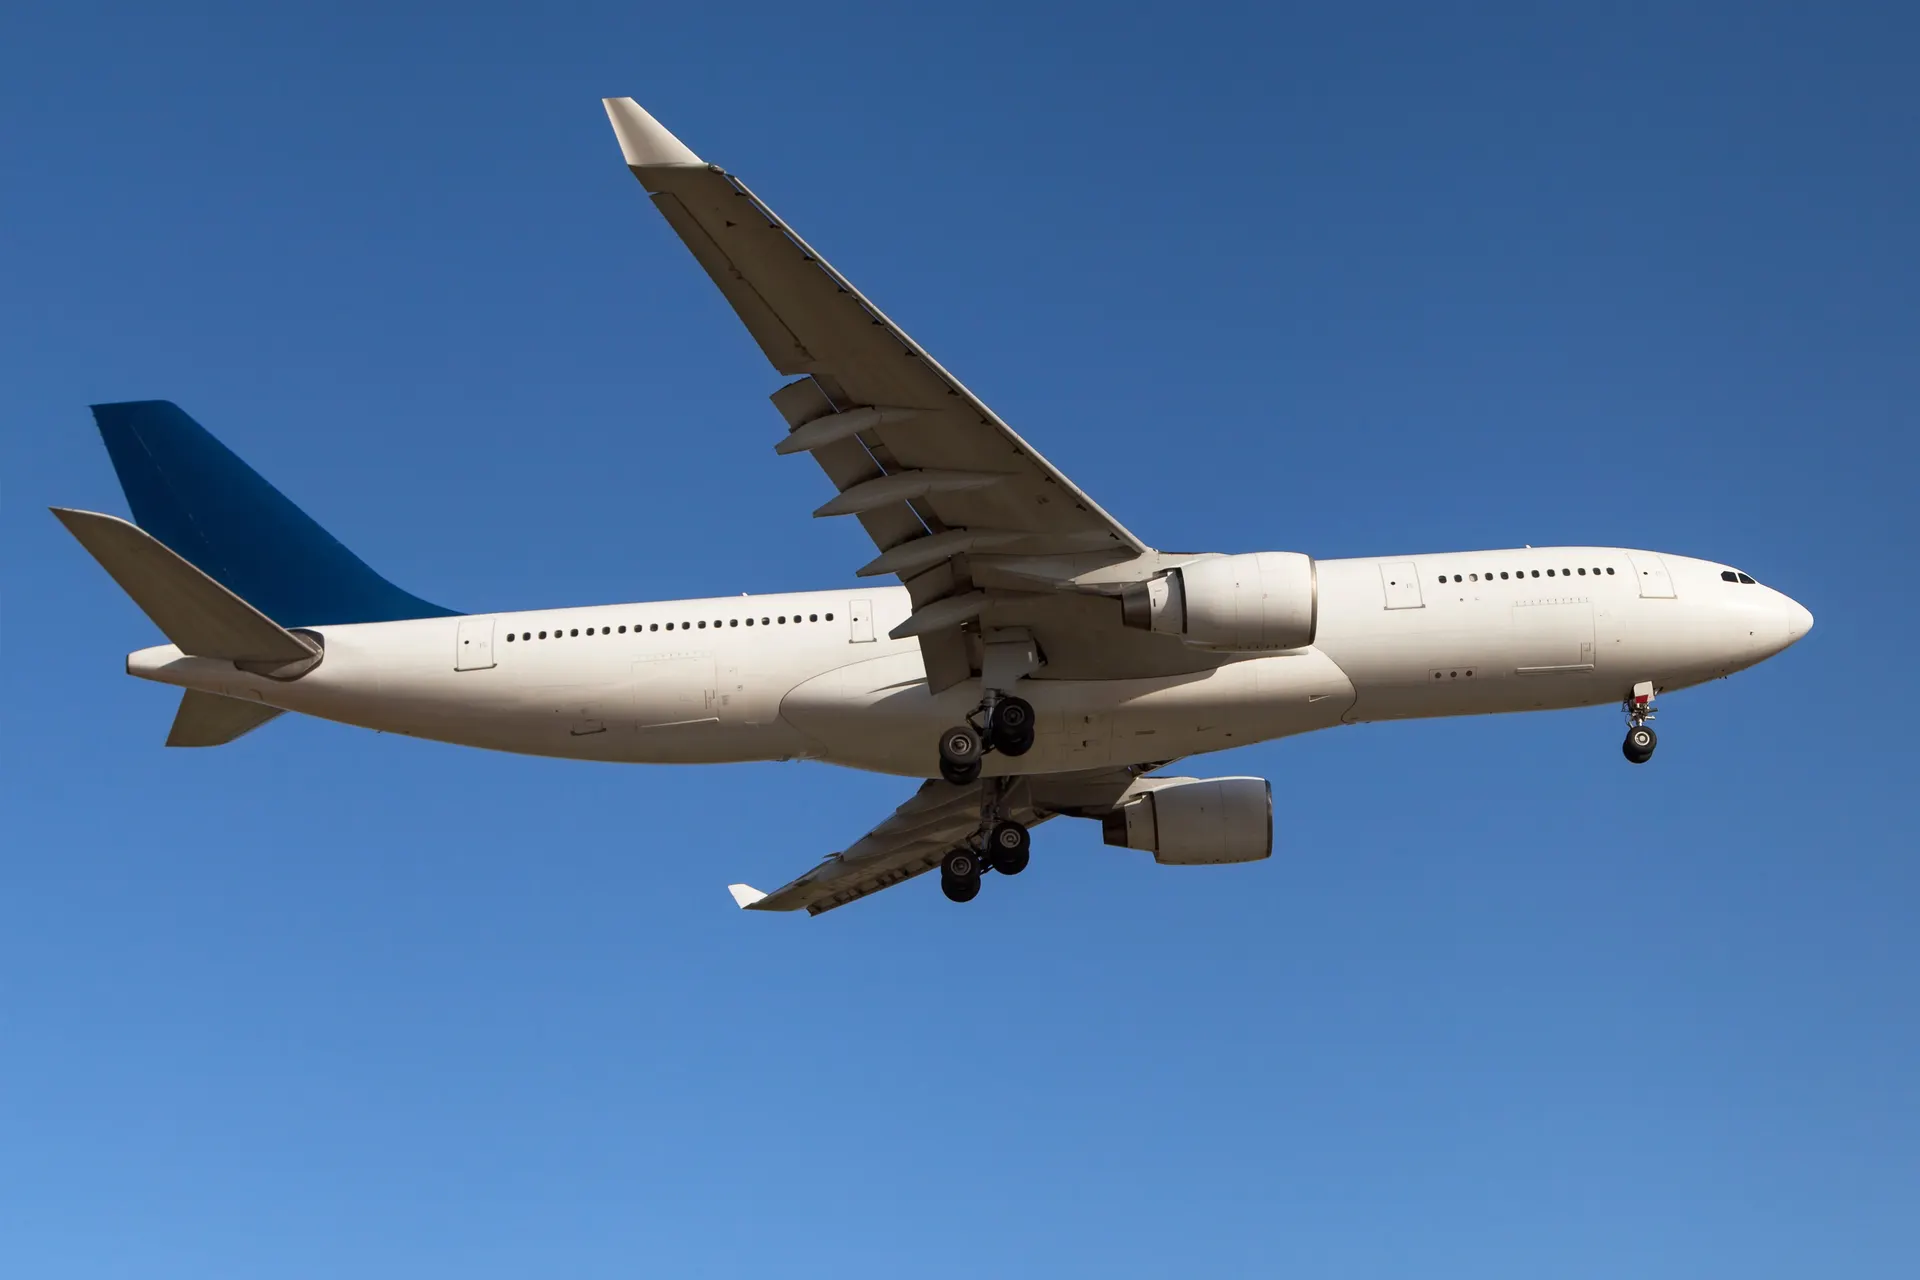
An Airbus A320 has an average list price of $101,000,000 in the maker's 2018 table. The A321neo lists at $129,500,000, the A350-900 at $317,400,000 and the A380 at $445,600,000. Those are Airbus's own list figures, and almost no airline pays them.
Around the price sit the facts that explain it. The FAA register holds 2,616 Airbus airliners of the types covered here, and the A321 is the biggest family on it. Airbus has delivered 12,900 aircraft of the A320 family, 11,374 of them are in its fleet tally, and 7,535 more are on order. US airlines reported $6,453 of direct operating expense for every airborne hour of the A320 family in 2025.
This page walks from the list price to the fleet to the running bill, then looks at what the NTSB accident files record. Every figure comes from a named public source with its date, and the sources are listed at the end. For the other big airliner maker, see the Boeing cost guide. For the whole airline fleet, including regional jets, see the commercial plane cost guide. At the other end of the market, the small plane cost guide covers the aircraft people buy for themselves.
Data used: FAA registry through 2026-10-12; NTSB files through 2026-09-30. Source periods are shown with each table.
What an Airbus list price tells you, and what it leaves out
Airbus publishes a table of average list prices by model. The edition we could verify is 2018, so every price in this section is a 2018 list price and says so. The table has no A220 and none of the older A300, A310 or A340, so those types have no price here. A newer table would replace these figures.
Average list prices from the 2018 table. The gold bar is the A320. These are not prices paid.


The ladder is steep. An A350-900 lists at 3.1 times the price of an A320, and the A380 at 4.4 times. The A380 tops the table at $445,600,000, above the A350-1000 at $366,500,000 and the A330-900 at $296,400,000.
The A320 family, ceo and neo
The table prices the A320 family in two generations. The A320neo lists $9,600,000 above the A320 and the A321neo $11,200,000 above the A321, so the newer engines add to the list price in both sizes. The family runs from the A318 at $77,400,000 to the A321neo at $129,500,000.
- A318$77,400,000The lowest price in the table
- A319$92,300,000Current engine option
- A320$101,000,000Current engine option
- A321$118,300,000Current engine option
- A319neo$101,500,000New engine option
- A320neo$110,600,000New engine option
- A321neo$129,500,000New engine option, the highest price in the family
Show the full list-price table
| Model | Price year | Historical list price | Dated source basis |
|---|---|---|---|
| A318 | 2018 | $77,400,000 | 2018 average list price, Airbus |
| A319 | 2018 | $92,300,000 | 2018 average list price, Airbus |
| A320 | 2018 | $101,000,000 | 2018 average list price, Airbus |
| A321 | 2018 | $118,300,000 | 2018 average list price, Airbus |
| A319neo | 2018 | $101,500,000 | 2018 average list price, Airbus |
| A320neo | 2018 | $110,600,000 | 2018 average list price, Airbus |
| A321neo | 2018 | $129,500,000 | 2018 average list price, Airbus |
| A330-200 | 2018 | $238,500,000 | 2018 average list price, Airbus |
| A330-800 (neo) | 2018 | $259,900,000 | 2018 average list price, Airbus |
| A330-200 Freighter | 2018 | $241,700,000 | 2018 average list price, Airbus |
| A330-300 | 2018 | $264,200,000 | 2018 average list price, Airbus |
| A330-900 (neo) | 2018 | $296,400,000 | 2018 average list price, Airbus |
| A350-800 | 2018 | $280,600,000 | 2018 average list price, Airbus |
| A350-900 | 2018 | $317,400,000 | 2018 average list price, Airbus |
| A350-1000 | 2018 | $366,500,000 | 2018 average list price, Airbus |
| A380 | 2018 | $445,600,000 | 2018 average list price, Airbus |
Historical list prices, not what airlines pay. Actual prices are negotiated and can be far below list. No discount is assumed.
Source publication: 2018-01-15. Effective: 2018-01-01.
Who flies them: the FAA register
The FAA register holds 2,616 registrations for these Airbus types, and it marks 2,610 of them valid. The other 6 carry a different status. The register covers aircraft with US registration only, so it is a slice of the world fleet, not the whole of it, and it does not say whether an aircraft is flying today. For the other types of aircraft that fly in the United States, see the types of planes guide.
The A318 has no registrations. The A320 family is the A318, A319, A320 and A321.
The A321 leads, with 929 registrations or 35.5% of the register. The A320 follows at 798 and the A319 at 328. The A220 is the fourth-largest family at 227. The A330 has 154 and the A350 42.
- 91980s
- 2201990s
- 5872000s
- 8552010s
- 7562020s
189 records have a blank or invalid build year and are left out of the chart.
855 of these aircraft were built in the 2010s and 756 in the 2020s so far. Together that is 66% of the registrations with a usable build year. The oldest registered airframe dates from 1983.
By registrant type, corporations hold 2,427 of the registrations and LLCs hold 182.
Download the fleet CSV by model and build year. Free to use, please link back. It counts all registrations and valid ones by model label and build year, including blank years, and contains no personal records.
Show the registered-aircraft table
| Family | All registration statuses | Valid registrations |
|---|---|---|
| A220 | 227 | 227 |
| A300 | 120 | 120 |
| A310 | 4 | 4 |
| A318 | 0 | 0 |
| A319 | 328 | 328 |
| A320 | 798 | 795 |
| A321 | 929 | 927 |
| A330 | 154 | 153 |
| A340 | 10 | 10 |
| A350 | 42 | 42 |
| A380 | 4 | 4 |
| Total | 2,616 | 2,610 |
FAA registry through 2026-10-12. Registration is not proof of active airline service.
Delivered, in the fleet, and still to build
The FAA register stops at the US border, so the world picture comes from Airbus itself. Its orders and deliveries table, dated September 2026, gives three numbers for each family: aircraft delivered, aircraft Airbus counts as in its fleet, and orders not yet delivered.
Deliveries are not aircraft in service. They include every aircraft handed over, whether it is still flying or not.
The A320 family is the giant. Airbus has delivered 12,900 of them, against 1,674 A330s and 737 A350s. The A300 stands at 561, the A220 at 550, the A340 at 377, the A380 at 251 and the A310 at 255.
The in-fleet column shows how far each family sits below its delivery count. The A320 family has 11,374 in fleet against 12,900 delivered. The A380 has 193 against 251, a gap of 58, and the A300 has 180 against 561, a gap of 381. The A310 is down to 25 in fleet from 255 delivered. The A350 has 736 in fleet from 737 delivered.
The order book looks forward. The A320 family has 7,535 unfilled orders, and 5,656 of them are for the A321neo. The A350 has 887, the A220 557 and the A330 331. The A350 freighter has 0 aircraft delivered and 115 aircraft unfilled.
Show the deliveries, in-fleet and orders tables
| Maker family | Cumulative deliveries | Unfilled orders | As of |
|---|---|---|---|
| A220 | 550 aircraft | 557 aircraft | 2026-09-30 |
| A320_family | 12,900 aircraft | 7,535 aircraft | 2026-09-30 |
| A300 | 561 aircraft | 0 aircraft | 2026-09-30 |
| A310 | 255 aircraft | 0 aircraft | 2026-09-30 |
| A330 | 1,674 aircraft | 331 aircraft | 2026-09-30 |
| A340 | 377 aircraft | 0 aircraft | 2026-09-30 |
| A350 | 737 aircraft | 887 aircraft | 2026-09-30 |
| A380 | 251 aircraft | 0 aircraft | 2026-09-30 |
Cumulative maker orders in the Worldwide table.
Cumulative maker deliveries. Not active fleet.
Worldwide cumulative orders minus cumulative deliveries.
Maker In Fleet measure, including leased and secondhand aircraft. Not cumulative deliveries. No active-operation claim.
| Maker family | In fleet | As of |
|---|---|---|
| A220 | 544 aircraft | 2026-09-30 |
| A320_family | 11,374 aircraft | 2026-09-30 |
| A300 | 180 aircraft | 2026-09-30 |
| A310 | 25 aircraft | 2026-09-30 |
| A330 | 1,401 aircraft | 2026-09-30 |
| A340 | 140 aircraft | 2026-09-30 |
| A350 | 736 aircraft | 2026-09-30 |
| A380 | 193 aircraft | 2026-09-30 |
Maker-defined in-fleet counts are separate from cumulative deliveries and the US registry.
What an airline spends per hour in the air
Airlines in the United States report their direct operating costs to the Bureau of Transportation Statistics, aircraft type by aircraft type. For 2025 the Form 41 Schedule P-5.2 data give a cost for every airborne hour, which is the time from wheels up to wheels down.
Across 8 carriers the A320 family flew 1,559,180 airborne hours and reported $6,453 of direct operating expense for each one. The A319 reported $5,819, the A321 $6,501, the A220 $6,101 and the A330 $9,600. The A330 costs 1.5 times as much per hour as the A320 family.
Direct operating expense as US airlines report it. An average across carriers and seating layouts, not a price list or a lease rate.
Fuel burn climbs with the size of the aircraft. The A220 burned 771 US gallons per airborne hour, the A320 family 914 and the A330 family 1,946. Fuel is about a third of the A320 family's direct cost and more than two-fifths of the A330 family's.
Show the operating-cost table
| BTS aircraft description | US reporting carriers | Direct operating expense | Fuel gallons | Fuel share of direct expense |
|---|---|---|---|---|
| Airbus Industrie A320-100/200 | 8 carriers | $6,480 per airborne hour | 924.5 US gal per airborne hour | 33.6% |
| Airbus Industrie A330-200 | 4 carriers | $9,729 per airborne hour | 1,932.6 US gal per airborne hour | 41.0% |
| Airbus Industrie A319 | 7 carriers | $5,819 per airborne hour | 884.0 US gal per airborne hour | 35.5% |
| Airbus Industrie A321-200n | 7 carriers | $6,501 per airborne hour | 862.6 US gal per airborne hour | 31.9% |
| A220-300 BD-500-1A11 | 3 carriers | $6,100 per airborne hour | 798.6 US gal per airborne hour | 32.5% |
2025. US reporting carriers only, passenger configuration, all reporting regions. Ratios use summed numerators and airborne hours, not block hours. Fuel expense is already included in direct operating expense. Suppressed codes are omitted; combined descriptions are retained.
What the accident files record
The NTSB file lists 184 accidents involving these Airbus airliners between 2000 and 2025. Of those, 23 were fatal, and the fatal events reported 2,387 deaths in total. That figure covers everyone killed in those events, including people on other aircraft and on the ground.
The A318 has no records, and 2 events involved aircraft from more than one family. Both are in the table.
Show the NTSB tables
| Aircraft | Accidents | Fatal accidents | Reported event deaths |
|---|---|---|---|
| A220 | 4 | 1 | 1 |
| A300 | 7 | 4 | 268 |
| A310 | 6 | 4 | 475 |
| A318 | 0 | 0 | 0 |
| A319 | 31 | 0 | 0 |
| A320 | 65 | 9 | 930 |
| A321 | 29 | 2 | 381 |
| A330 | 26 | 2 | 331 |
| A340 | 5 | 0 | 0 |
| A350 | 6 | 1 | 1 |
| A380 | 3 | 0 | 0 |
| One event with included aircraft in different families | 2 | 0 | 0 |
| Total | 184 | 23 | 2,387 |
2000 to 2025. US-focused NTSB records, including some foreign events where NTSB took part. These are not worldwide totals. Counts never establish rates or safety rankings. Reported deaths include other aircraft and ground deaths in a collision. Different families in one event have a separate row.
| Scope | Accidents left out | Fatal accidents left out | Reported event deaths left out |
|---|---|---|---|
| Not included in family totals | 0 | 0 | 0 |
These model labels do not identify a commercial aircraft. The counts are excluded from all family totals and annual counts.
Worldwide hull-loss counts for Airbus types sit in Boeing's statistical summary, which covers the worldwide commercial jet fleet from 1959 to 2024. They are on the Boeing costs page, with the summary's scope and its limits. Airbus publishes its own accident statistics, which this page does not reproduce. Business jets sit in a different market, and the Gulfstream jet cost guide covers their prices.
Questions people ask
How much does a new Airbus A320 cost?
Airbus's 2018 average list price table puts the A320 at $101,000,000 and the A320neo at $110,600,000. Those are list prices. Airlines negotiate, and the prices they pay are not public.
How much does an Airbus A350 cost?
The 2018 table lists the A350-900 at $317,400,000 and the A350-1000 at $366,500,000. These are list prices, not what an airline pays.
How much does an Airbus A380 cost?
The A380 was listed at $445,600,000 in the 2018 table. Airbus delivered 251 of them, and its in-fleet count stands at 193.
How much does it cost to fly an Airbus A320 for an hour?
US airlines reported $6,453 of direct operating expense per airborne hour for the A320 family in 2025. That is an average, and it adds no lease rates or overhead.
How many Airbus planes are there?
The FAA register holds 2,616 of these Airbus airliners, which covers US-registered aircraft only. Worldwide, Airbus has delivered 12,900 aircraft of the A320 family alone, and counts 11,374 of them in its fleet.
Is the A321 more common than the A320 in the United States?
On the FAA register, yes: 929 registrations against 798. Worldwide the A320 family delivered 12,900 aircraft in all, and the register covers US-registered aircraft only.
Related guides: How Much Does a Cargo Plane Cost?.
Keep PilotPassion in your Google results
Add us as a preferred source and we are more likely to appear in your Top Stories.
Sources and how the numbers were made
- Federal Aviation Administration. Releasable Aircraft Database. Retrieved 2026-10-13. The registry supplies fleet counts by model, build year, registrant type and state.
- Federal Aviation Administration. Aircraft Registration Database Description. Retrieved 2026-10-13. This document explains registration status and registrant-type codes.
- Federal Aviation Administration. Type Certificate Data Sheet T00008NY. Retrieved 2026-10-14. The FAA sheet supplies certified approval dates, engines, thrust and weights for the covered models.
- Federal Aviation Administration. Type Certificate Data Sheet A28NM. Retrieved 2026-10-14. The FAA sheet supplies certified approval dates, engines, thrust and weights for the covered models.
- Federal Aviation Administration. Type Certificate Data Sheet A43NM. Retrieved 2026-10-14. The FAA sheet supplies certified approval dates, engines, thrust and weights for the covered models.
- Federal Aviation Administration. Type Certificate Data Sheet A46NM. Retrieved 2026-10-14. The FAA sheet supplies certified approval dates, engines, thrust and weights for the covered models.
- Federal Aviation Administration. Type Certificate Data Sheet A58NM. Retrieved 2026-10-14. The FAA sheet supplies certified approval dates, engines, thrust and weights for the covered models.
- Federal Aviation Administration. Type Certificate Data Sheet T00063IB. Retrieved 2026-10-14. The FAA sheet supplies certified approval dates, engines, thrust and weights for the covered models.
- Federal Aviation Administration. Type Certificate Data Sheet A35EU. Retrieved 2026-10-14. The FAA sheet supplies certified approval dates, engines, thrust and weights for the covered models.
- National Transportation Safety Board. Aviation accident data: avall. Retrieved 2026-10-13. The records from 2008 onward supply the NTSB counts.
- National Transportation Safety Board. Historical aviation accident data: Pre2008. Retrieved 2026-10-13. The earlier records supply the years 2000 to 2007.
- National Transportation Safety Board. Aviation accident database data dictionary. Retrieved 2026-10-13. The data dictionary defines the injury and event codes.
- National Transportation Safety Board. Aviation accident data download directory. Retrieved 2026-10-13. The download directory lists the published files and their dates.
- National Transportation Safety Board. Aviation accident database release notes. Retrieved 2026-10-13. The release notes describe what each file contains.
- National Transportation Safety Board. Aviation accident database search help. Retrieved 2026-10-13. The search help explains how the NTSB selects and labels records.
- National Transportation Safety Board. Aviation accident database scope. Retrieved 2026-10-13. The scope note states that the database is US-focused and which events it covers.
- Federal Aviation Administration. General Aviation and Part 135 Activity Survey. Retrieved 2026-10-13. The survey is cited to explain why no accident rates are given.
- Airbus. 2018 average list prices. Retrieved 2026-10-14. The table supplies the 2018 Airbus average list prices.
- Airbus. Orders, deliveries and in fleet, Worldwide, Summary to 30 Sep 2026. Retrieved 2026-10-14. Airbus's orders, deliveries and in-fleet table supplies deliveries, aircraft in fleet and unfilled orders.
- Bureau of Transportation Statistics. Form 41 Schedule P-5.2 annual 2025. Retrieved 2026-10-14. Schedule P-5.2 supplies direct operating expense, fuel and airborne hours by aircraft type.
- Bureau of Transportation Statistics. Aircraft type lookup. Retrieved 2026-10-14. The lookup matches BTS aircraft codes to type descriptions.
- Bureau of Transportation Statistics. P-5.2 field descriptions. Retrieved 2026-10-14. The field descriptions define the P-5.2 columns.